It allows to keep PV going, with more focus towards AI, but keeping be one of the few truly independent places.
-

 income.jpg800 x 389 - 57K
 -
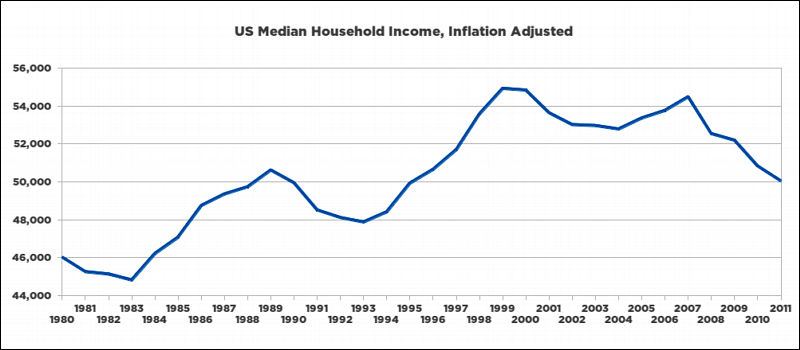
interesting to compare with cost of living increases, especially gas and insurance prices, and need to factor long-term unemployed
Stock Market rallied to record highs today as Bernanke announces the fed will keep priming the pump
quite weird, that the only people telling the truth about the current state of the depression / oppression in the US are in Russia lately...
-
That's a median of around $26 an hour, working full time - unless I'm a math retard... which is totally possible. I haven't worked in the regular job market for years, but I've worked with broadcasters in the last few years who have payed me day rates as low as $250 a day (often more than 8 hours), which isn't a far stretch from that median, which is just over $200 for exactly 8 hours.
-
@JuMo That's household income and now a days that means at least 2 people!
-
@Scot Ah, yes, right, thank you for clarifying. That is much worse. Yikes!
-
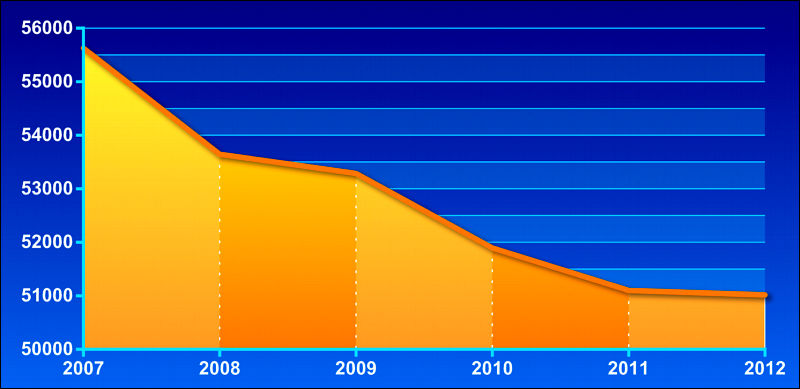
That chart looks like a huge drop at first glance, but then one notices it's about six grand a year. Still, it's a hit and worrisome trend.
-
when you factor in inflation, especially food costs, the hit is even worse.
-
Yes the chart is deceptive since the scale is very blown up. The reality is that median income has always had an oscillatory nature, check the chart history on the link that Vitaliy provided. It is a slightly bigger drop than the past but there is only a few oscillations recorded.
-
The chart is misleading in several ways...one, the scale makes it appear as if household income has fallen off a cliff, when in fact it's about an 11% drop. Second, it uses it's baseline year as the last year of a bubble. A chart that went back to say, 2002, wouldn't look so disastrous...it would show a sudden upswing and then a drop. It doesn't factor in inflation, but inflation in the US has been very low for the past twenty years, and almost non-existent since the 2008 crash.
But perhaps the most shocking thing about this chart is that if you compare it to many countries around the world, especially many EU member states, it makes the US economy look like a miracle.
-
one, the scale makes it appear as if household income has fallen off a cliff
LOL, scale has clear numbers.
Going to baseline year, let's open wikipedia chart

As you can see, inflation adjusted income is at about 1995 levels.
But perhaps the most shocking thing about this chart is that if you compare it to many countries around the world, especially many EU member states, it makes the US economy look like a miracle.
In many countries media income increased, in some dropped. If you want to get some foundations, you can just get back in the blog posts about energy and resources.

 qx1.jpg800 x 350 - 41K
 -
To push further on this topic I encourage to watch a lecture from a very good economist (I mean : his work is actually based on sources! Not common... :-) ) he speak english like me (...) but give a good presentation of the evolution of the Capital during XXth and XXI century in US and some comparaison with EU countries during the same period.
http://www.youtube.com/playlist?list=PLbdYmEXIEvkqObNCW5ASQV2lUP9FvRSS_
He recently published a very good book that I'm actually reading (The Capital in XXI century). It will be available in english via Harvard University Press in 2014. (Ps : no, I don't know the men personnaly... and it's not me)
-
If anyone's wondering where the money went:

 income.gif977 x 668 - 58K
 income2.jpg672 x 462 - 176K
 -
When I see the numbers and think of the related things that have caused this, that is one side of the story. And a completely valid pursuit to discuss and explore.
This hit me in a different way. Me personally, I can say that I have been trying my best to live on less. Not because I have to (my income has increased by appx $40K since 2007)....but because I find it to be a ridiculous waste to be manipulated by mindless materialism and consumerism. I have no problem at all with people getting what they want...that's fine. But it has gotten a little out of control (here in the US anyway). So, I'm glad that we have to live with less....NOW, let's hope that we actually learn some thing from it.
Cheers Peeps!
-
It is not really about learning. It is about accomodating to the world with less things to get, less affordable and fewer food, and no affordable cars at all. I mean back to the 1920s.
-
I agree that people the world over need food and water and affordable cars. Americans on the other hand....can do without their 4th tv, their 5th phone, their 3rd car. ..and they can learn to be happy without getting MORE STUFF. :) Cheers!
-
I agree that people the world over need food and water and affordable cars.
I think you get me wrong. I just very gently described your near future. As for other world, it'll be much worse.
-
Many agree with you and that is fair enough. Some are actually preparing for it, expecting it.
And yet we have all been here before, yes? And certainly, I don't want my children to live in a "shattered" world. That said, we've been asking for it for some time now. Living WAY BEYOND our means. It inspires me when I see people living simple lives on much, much less. Thanks again for the post. Good stuff. As I share these links below, I hope you know that this is related to "people in a modern economy can live with less". Enjoy.http://blog.ted.com/2011/10/05/less-stuff-more-happiness-graham-hill-on-ted-com/
-
That said, we've been asking for it for some time now. Living WAY BEYOND our means. It inspires me when I see people living simple lives on much, much less.
Thing you are asking for (live for less) is going agains simple nature and monkeys behaviour (and people are just 99% monkeys with some thin education and manners layer). In nature monkeys never had too much food, so they can't live comsuming less, they'll be consuming as much as they can, as the ones who did not do the same died long time ago and did not get any ancestors.
So, no, I am not guy who loves "green economy", as it is just modern bullshit to adopt monkeys minds with simple fact that they'll have less energy (read - will live much worse).
-
yeah, it's "inspiring" seeing people live with less, as long as it's the other guy living with less. there are a lot of people living with less and are hurting for it.
-
At this point, the issue isn't scarcity of resources. The U.S. is wealthier than ever and there's no shortage of goods and resources.
It's just that income distribution has changed radically.
-
The U.S. is wealthier than ever. It's just that income distribution has changed radically.
And this is totally wrong. U.S is not "wealthier than ever". In fact it is "income distribution" that hide how bad things are. As such screwed distribution prevents masses to ask something real for paper and bits aka dollars.
-
Totally wrong? Where is the evidence that national wealth has declined?
-
Where is the evidence that national wealth has declined?
If read blog or any other economic source you'll find as many as you want.
-
One citation would be fine. In any event, the chart you posted reflects distribution of income, not reduced national wealth There have been significant income gains from 2007 to the present, but they went almost entirely to the top 1% of earners, so median income went down.
-
U.S is not "wealthier than ever".
Exactly!
U.S. was at its wealthiest immediately following WWII, approximately owning 50% of the worlds wealth. It has been in decline since that time in terms of world wealth, although people continued to see growth in their own lives (incomes, economic mobility, etc) until around the late 70's. Since then, income has stagnated or declined except for very narrow sectors of society, while production has risen quite a bit as someone already stated above.
The US is now at about 25% of the worlds wealth, but while domination of the world economy is slipping, military might and direct threat (over 1000 bases worldwide with first strike capability being ubiquitous) is still increasing.
...and as VK has alluded, the situation for masses in US will get worse as the situation for masses elsewhere will get MUCH worse. I don't see a peaceful way out of this given our history of solving these issues primarily with a big stick.
None of this takes into account the fact that previous waves and cycles did not have to deal with:
- Peak oil
- Climate issues that threaten survival of even the most modest claims to any current first-world lifestyle.
-
One citation would be fine. In any event, the chart you posted reflects distribution of income, not reduced wealth There have been significant income gains from 2007 to the present, but they went almost entirely to the top 1% of earners, so median income went down.
If you talk about real wealth you need to talk not about dollar mass and GDP, but about real manufacturing, real oil and gas production (with EROI mentioning also).
So, all is good with digits, but not is good with real things.
Howdy, Stranger!
It looks like you're new here. If you want to get involved, click one of these buttons!
Categories
- Topics List23,979
- Blog5,725
- General and News1,352
- Hacks and Patches1,153
- ↳ Top Settings33
- ↳ Beginners255
- ↳ Archives402
- ↳ Hacks News and Development56
- Cameras2,362
- ↳ Panasonic991
- ↳ Canon118
- ↳ Sony156
- ↳ Nikon96
- ↳ Pentax and Samsung70
- ↳ Olympus and Fujifilm100
- ↳ Compacts and Camcorders300
- ↳ Smartphones for video97
- ↳ Pro Video Cameras191
- ↳ BlackMagic and other raw cameras116
- Skill1,961
- ↳ Business and distribution66
- ↳ Preparation, scripts and legal38
- ↳ Art149
- ↳ Import, Convert, Exporting291
- ↳ Editors191
- ↳ Effects and stunts115
- ↳ Color grading197
- ↳ Sound and Music280
- ↳ Lighting96
- ↳ Software and storage tips267
- Gear5,414
- ↳ Filters, Adapters, Matte boxes344
- ↳ Lenses1,579
- ↳ Follow focus and gears93
- ↳ Sound498
- ↳ Lighting gear314
- ↳ Camera movement230
- ↳ Gimbals and copters302
- ↳ Rigs and related stuff272
- ↳ Power solutions83
- ↳ Monitors and viewfinders339
- ↳ Tripods and fluid heads139
- ↳ Storage286
- ↳ Computers and studio gear560
- ↳ VR and 3D248
- Showcase1,859
- Marketplace2,834
- Offtopic1,319


